
Conformed Dimensions: Ensuring Identical Definitions for Key Dimensions Across Multiple Subject Areas
Conformed Dimensions: Ensuring Identical Definitions for Key Dimensions Across Multiple Subject Area

In the world of data, every organization dreams of a single source of truth — a unified voice that eliminates confusion and contradiction. But achieving that harmony isn’t easy. Imagine a symphony orchestra where every section plays a slightly different version of the same melody. The violins follow one rhythm, the cellos another, and the brass section improvises freely. The result? Chaos. That’s what happens in analytics when dimensions like “Customer,” “Time,” or “Product” differ across departments. Conformed Dimensions are the conductor’s baton that brings order to this data symphony — ensuring every note, or rather, every metric and definition, aligns perfectly.
The Backbone of a Unified Data Ecosystem
Think of a large retail company with multiple departments — sales, marketing, logistics, and finance. Each of these units collects and interprets data differently. The marketing team may define a “customer” as anyone who signed up for the newsletter, while the sales team only counts those who made a purchase. When leadership asks for a report on “total active customers,” chaos ensues. The marketing report shows 500,000; sales shows 200,000. Who’s right?
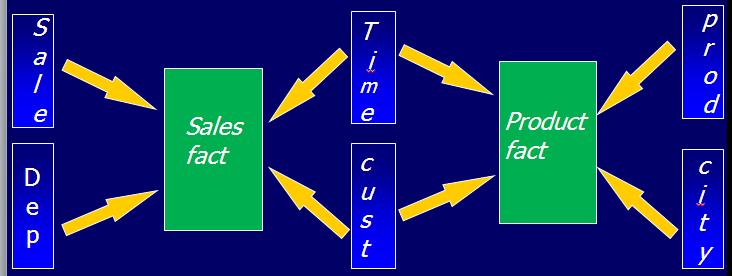
This is where Conformed Dimensions step in. They ensure that “Customer” has the same definition across every report, dashboard, and data mart. By enforcing identical attributes and hierarchies, they make integration seamless. Without them, data analytics turns into a guessing game.
In fact, mastering these principles is part of what professionals learn in a data analyst course in Pune, where real-world exercises often simulate such mismatched dimensions and teach how to standardize them for enterprise consistency.
Case Study 1: The Airline That Spoke Different Data Languages
A global airline faced a peculiar problem. The marketing team celebrated a 10% rise in “loyal customers,” while the finance department reported no such growth. Upon digging deeper, analysts found that marketing defined loyalty based on “app engagement,” while finance measured it by “ticket revenue.”
The data engineering team implemented a conformed “Customer” dimension that unified loyalty definitions — incorporating both engagement and revenue attributes. The outcome? Reports aligned across departments, and decisions became data-backed rather than debate-driven. Within six months, this harmony helped the airline optimize loyalty campaigns, improving retention rates by 18%.
This story underscores a lesson every learner in a data analytics course encounters early: inconsistency in dimensions leads to mistrust in insights. Conformed dimensions, on the other hand, transform fragmented systems into an integrated intelligence engine.
Case Study 2: The E-commerce Giant’s Product Dilemma
An e-commerce company selling electronics across multiple countries discovered inconsistencies in “Product Category” when trying to analyze global sales trends. In the Indian data mart, “Mobile Accessories” were grouped under “Mobiles,” while in the U.S. mart, they were part of “Electronics Accessories.” Reports comparing regions became useless — the numbers simply didn’t add up.
To solve this, the company created a Conformed Product Dimension, defining universal hierarchies and codes for each product group. This allowed the analytics team to merge data across countries effortlessly. As a result, their global insights became more accurate and actionable.
The process wasn’t just technical — it demanded negotiation between regional teams to settle on shared definitions. This human aspect of data modeling is often overlooked but deeply emphasized in professional training programs like a data analyst course in Pune, where communication between data engineers, analysts, and business stakeholders is treated as a core skill.
Case Study 3: The Healthcare Network’s Patient Paradox
In a large healthcare network, each hospital tracked patients differently. One recorded patient data based on “admission ID,” another by “insurance number,” and yet another by “social security.” When the central analytics team tried to study readmission patterns, duplicate records flooded the reports. The same person appeared as multiple patients, leading to skewed insights and poor resource allocation.
By introducing a Conformed Patient Dimension with a master identifier and standardized attributes (such as demographics, diagnosis categories, and admission history), the network achieved data harmony. This not only cleaned their reporting but also improved care coordination across hospitals. Post-implementation, readmission tracking accuracy jumped by 30%, directly impacting patient outcomes.
This case reveals how conformed dimensions aren’t just about data uniformity — they can literally save lives. For learners in any data analytics course, it’s a powerful reminder that sound data architecture fuels better human decisions.
Building and Maintaining Conformed Dimensions
Creating conformed dimensions requires more than technical design — it’s a cultural commitment. Organizations must align teams on common definitions before data is modeled. The process typically involves:
- Identification – Determine which dimensions (Customer, Product, Time, etc.) are shared across subject areas.
- Standardization – Define consistent hierarchies, naming conventions, and keys.
- Integration – Implement these definitions across all data marts and warehouses.
- Governance – Continuously monitor and update conformed dimensions as business logic evolves.
Conformed dimensions often reside in a centralized metadata layer or master data management (MDM) system. This ensures downstream systems inherit the same standards automatically, safeguarding analytical consistency across evolving data landscapes.
Conclusion: Harmony in Data, Harmony in Decisions
Data harmony is not achieved by chance — it’s engineered. Conformed dimensions serve as the backbone of trust across analytical ecosystems. They ensure that whether you’re analyzing customer churn, product sales, or regional growth, the language of data remains the same everywhere.
Organizations that adopt this discipline move from confusion to clarity, from silos to synergy. Whether you’re building your foundation through a data analyst course in Pune or advancing through an enterprise data analytics course, understanding conformed dimensions is non-negotiable. They don’t just align data — they align minds.
In a world where data fuels every decision, conformed dimensions remind us that true insight begins with a shared definition of truth.
Business Name: ExcelR – Data Science, Data Analytics Course Training in Pune
Address: 101 A ,1st Floor, Siddh Icon, Baner Rd, opposite Lane To Royal Enfield Showroom, beside Asian Box Restaurant, Baner, Pune, Maharashtra 411045
Phone Number: 098809 13504
Email Id: enquiry@excelr.com